X-Trace
Quick Start in 3 Steps
From setup to tracing in under a minute. No complex configuration required.
Setup Node
Configure Erlang distribution — set node name, cookie, and start the BEAM network.
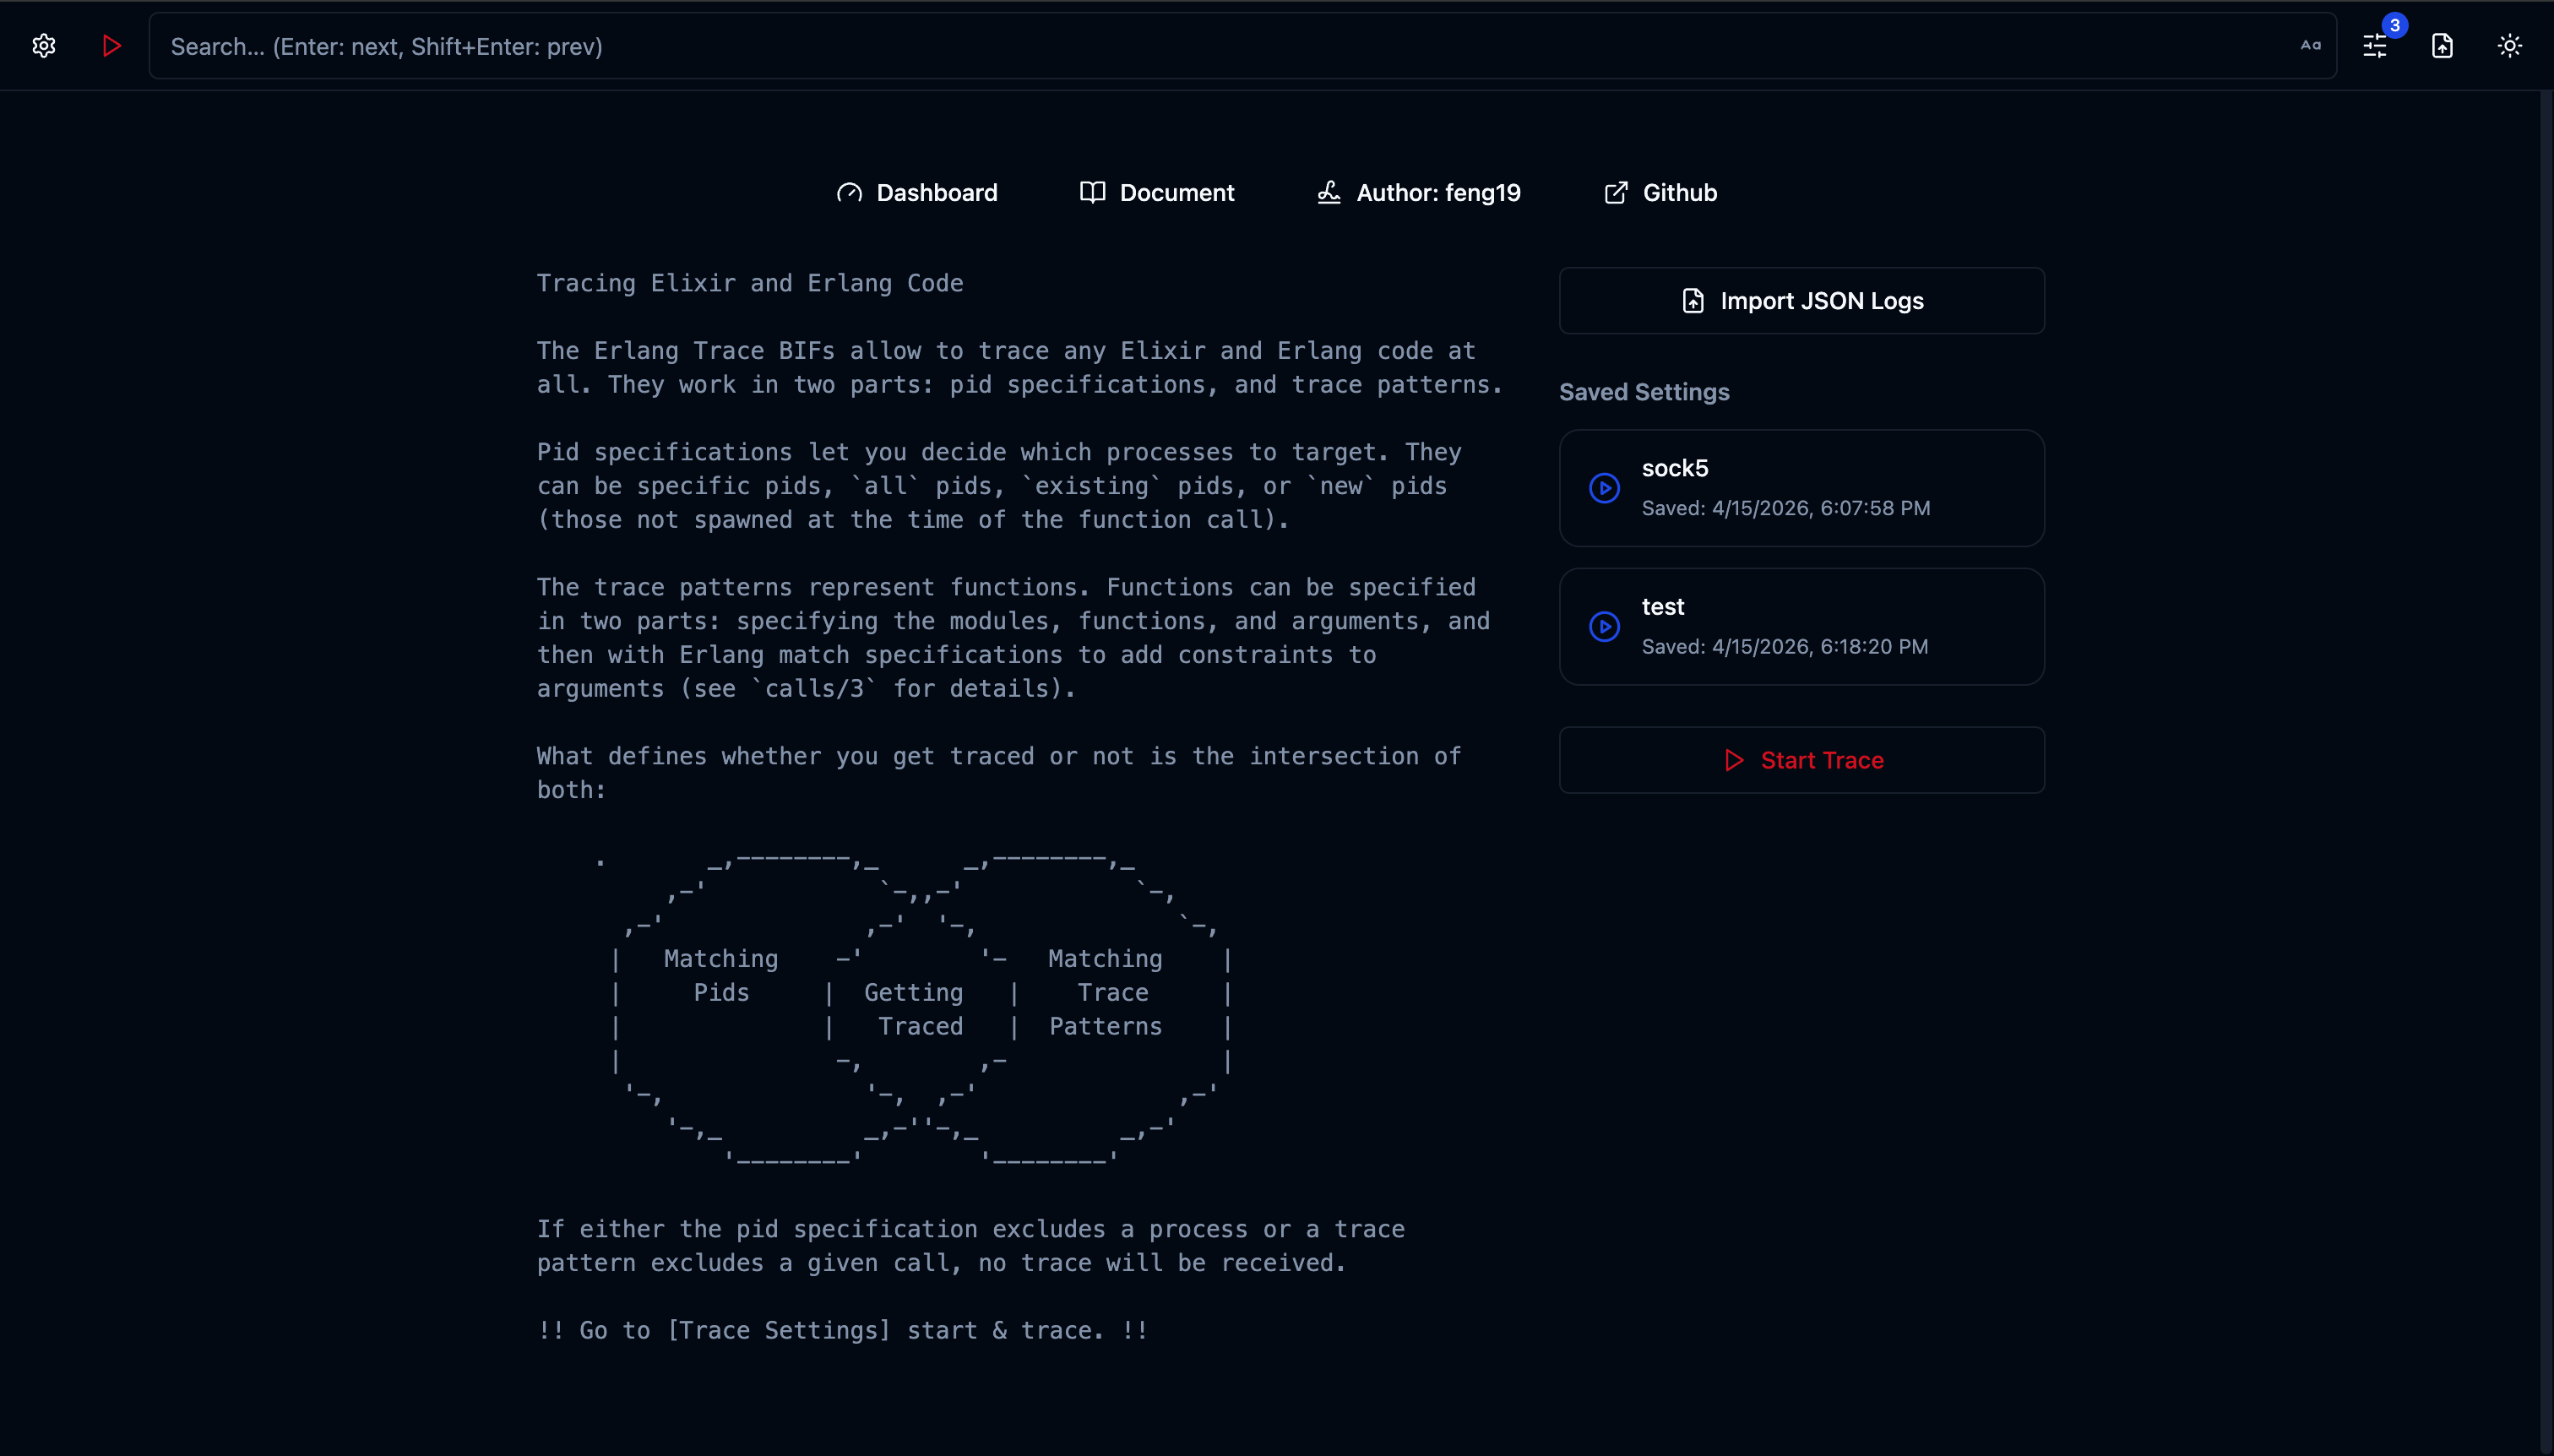
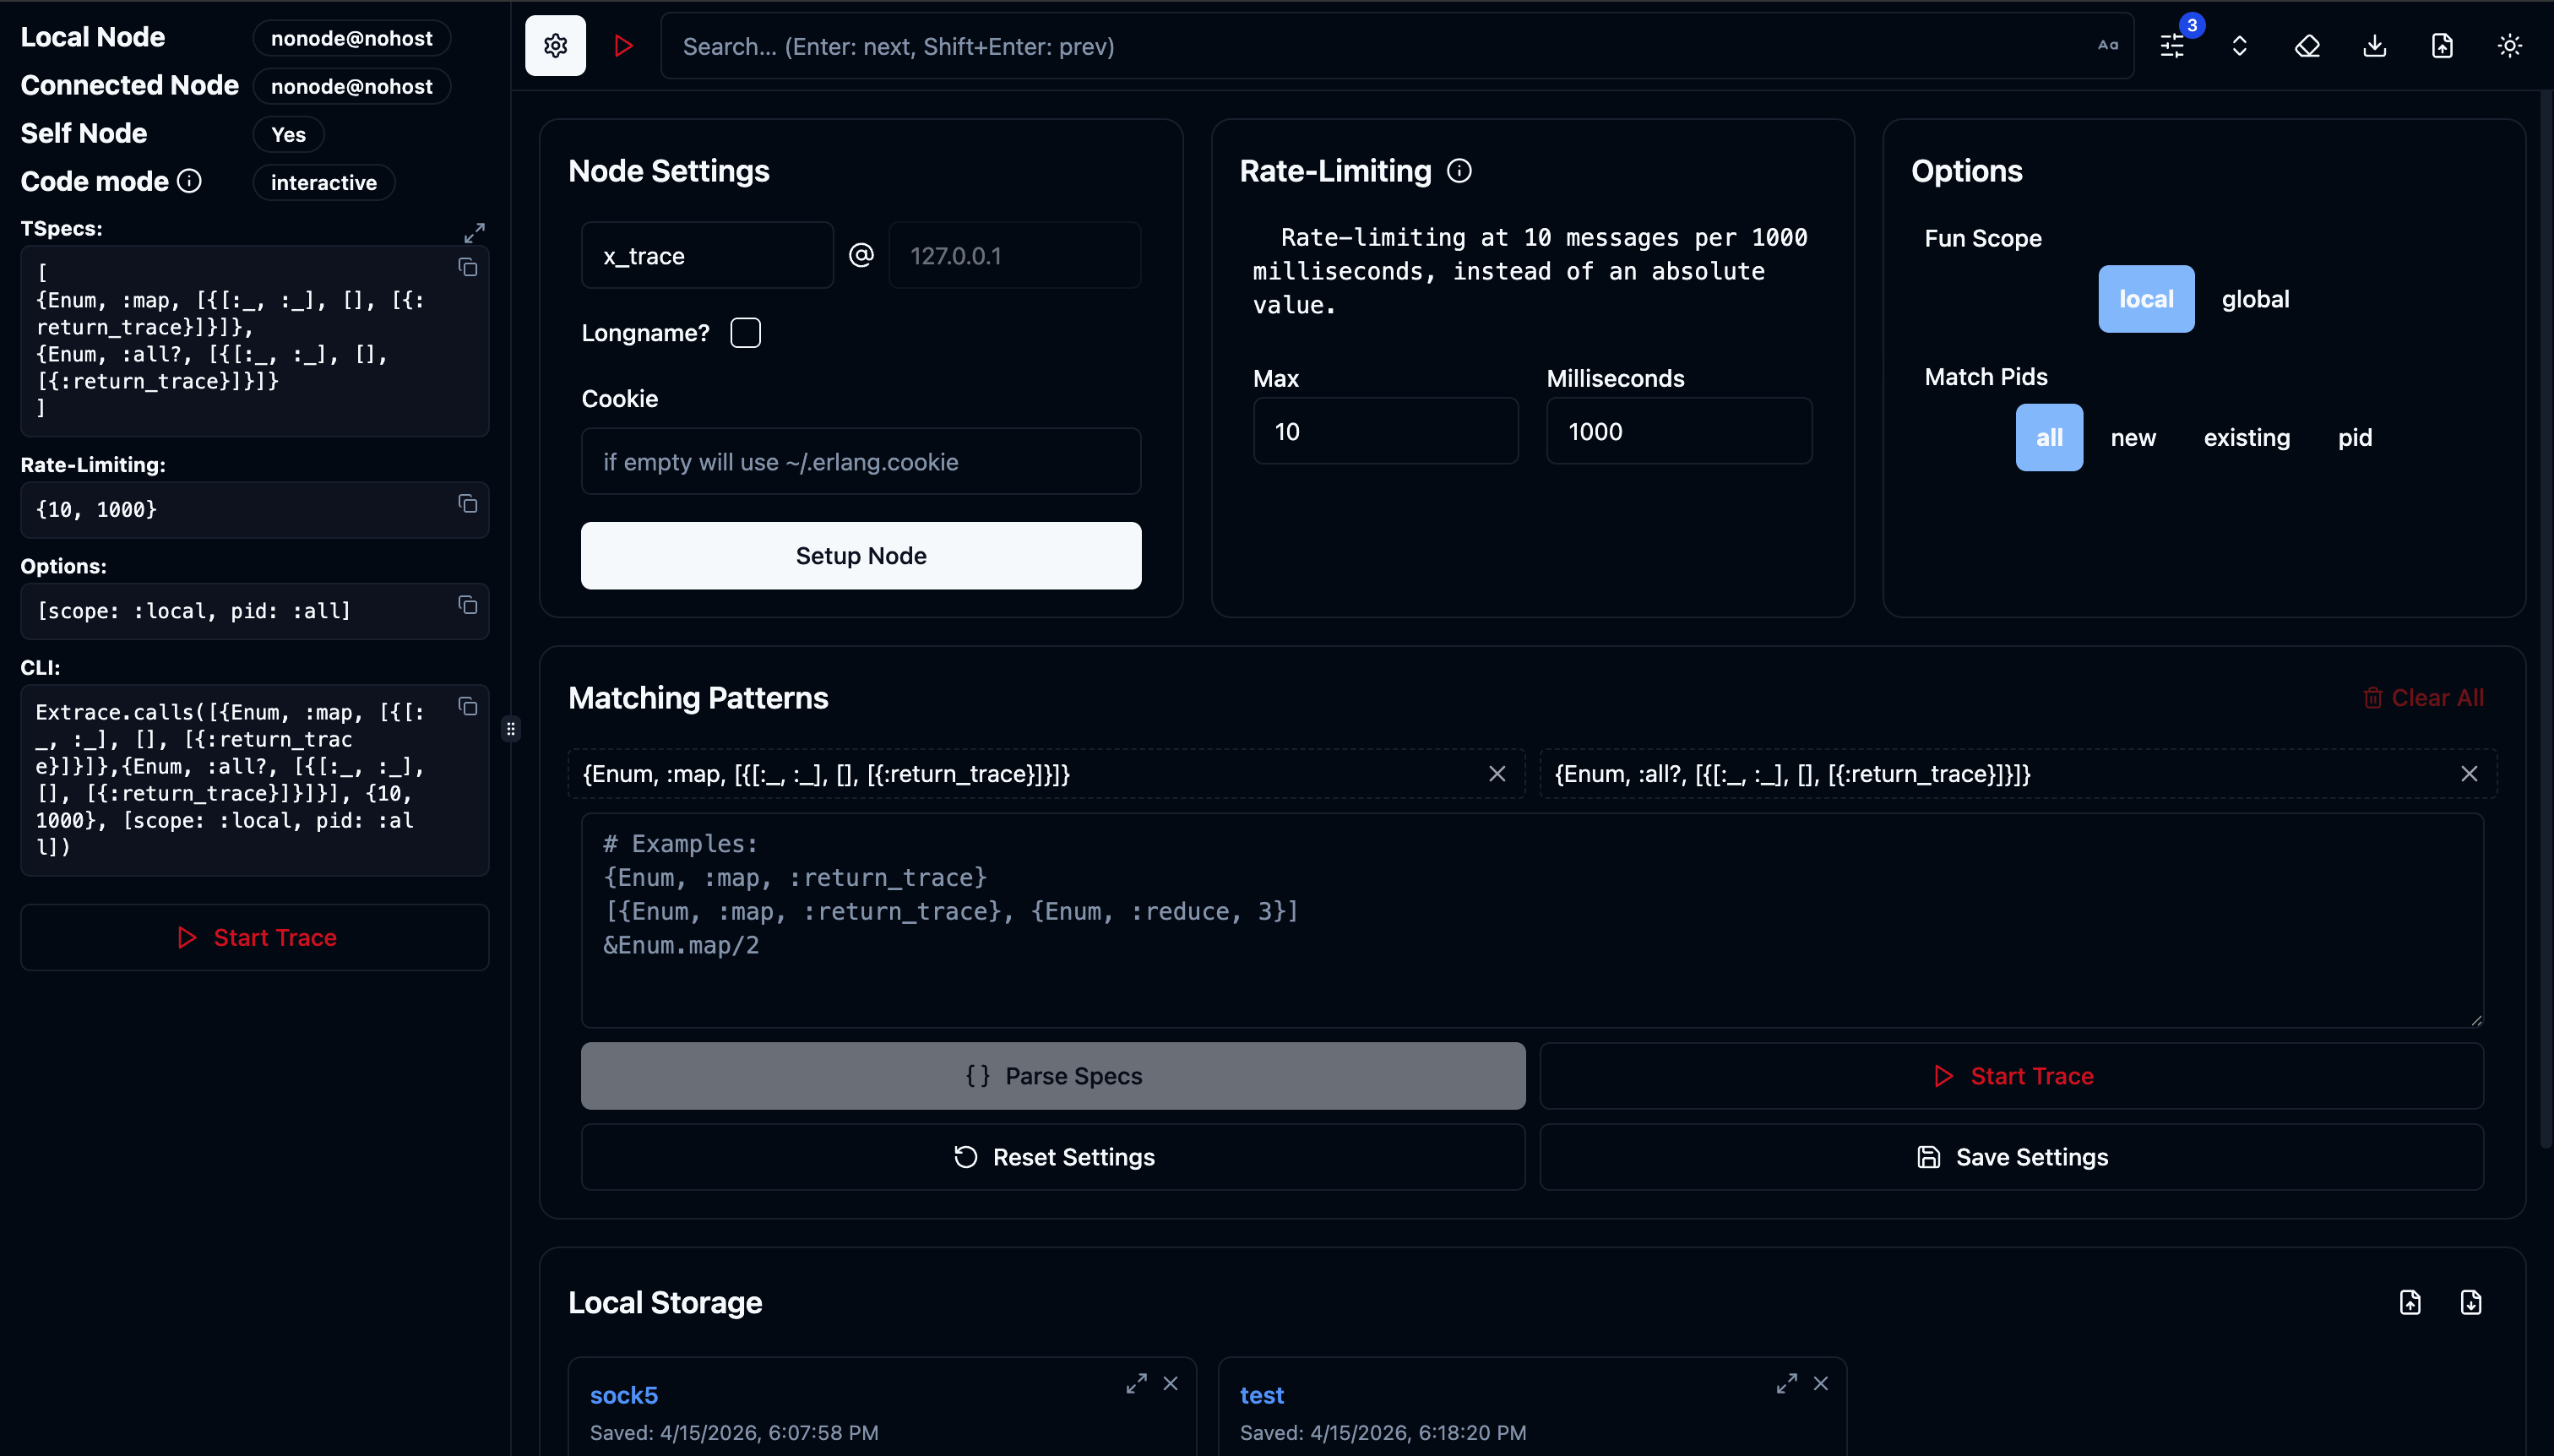
Configure Traces
Define trace specs — pick modules, functions, and match specs using an intuitive GUI.
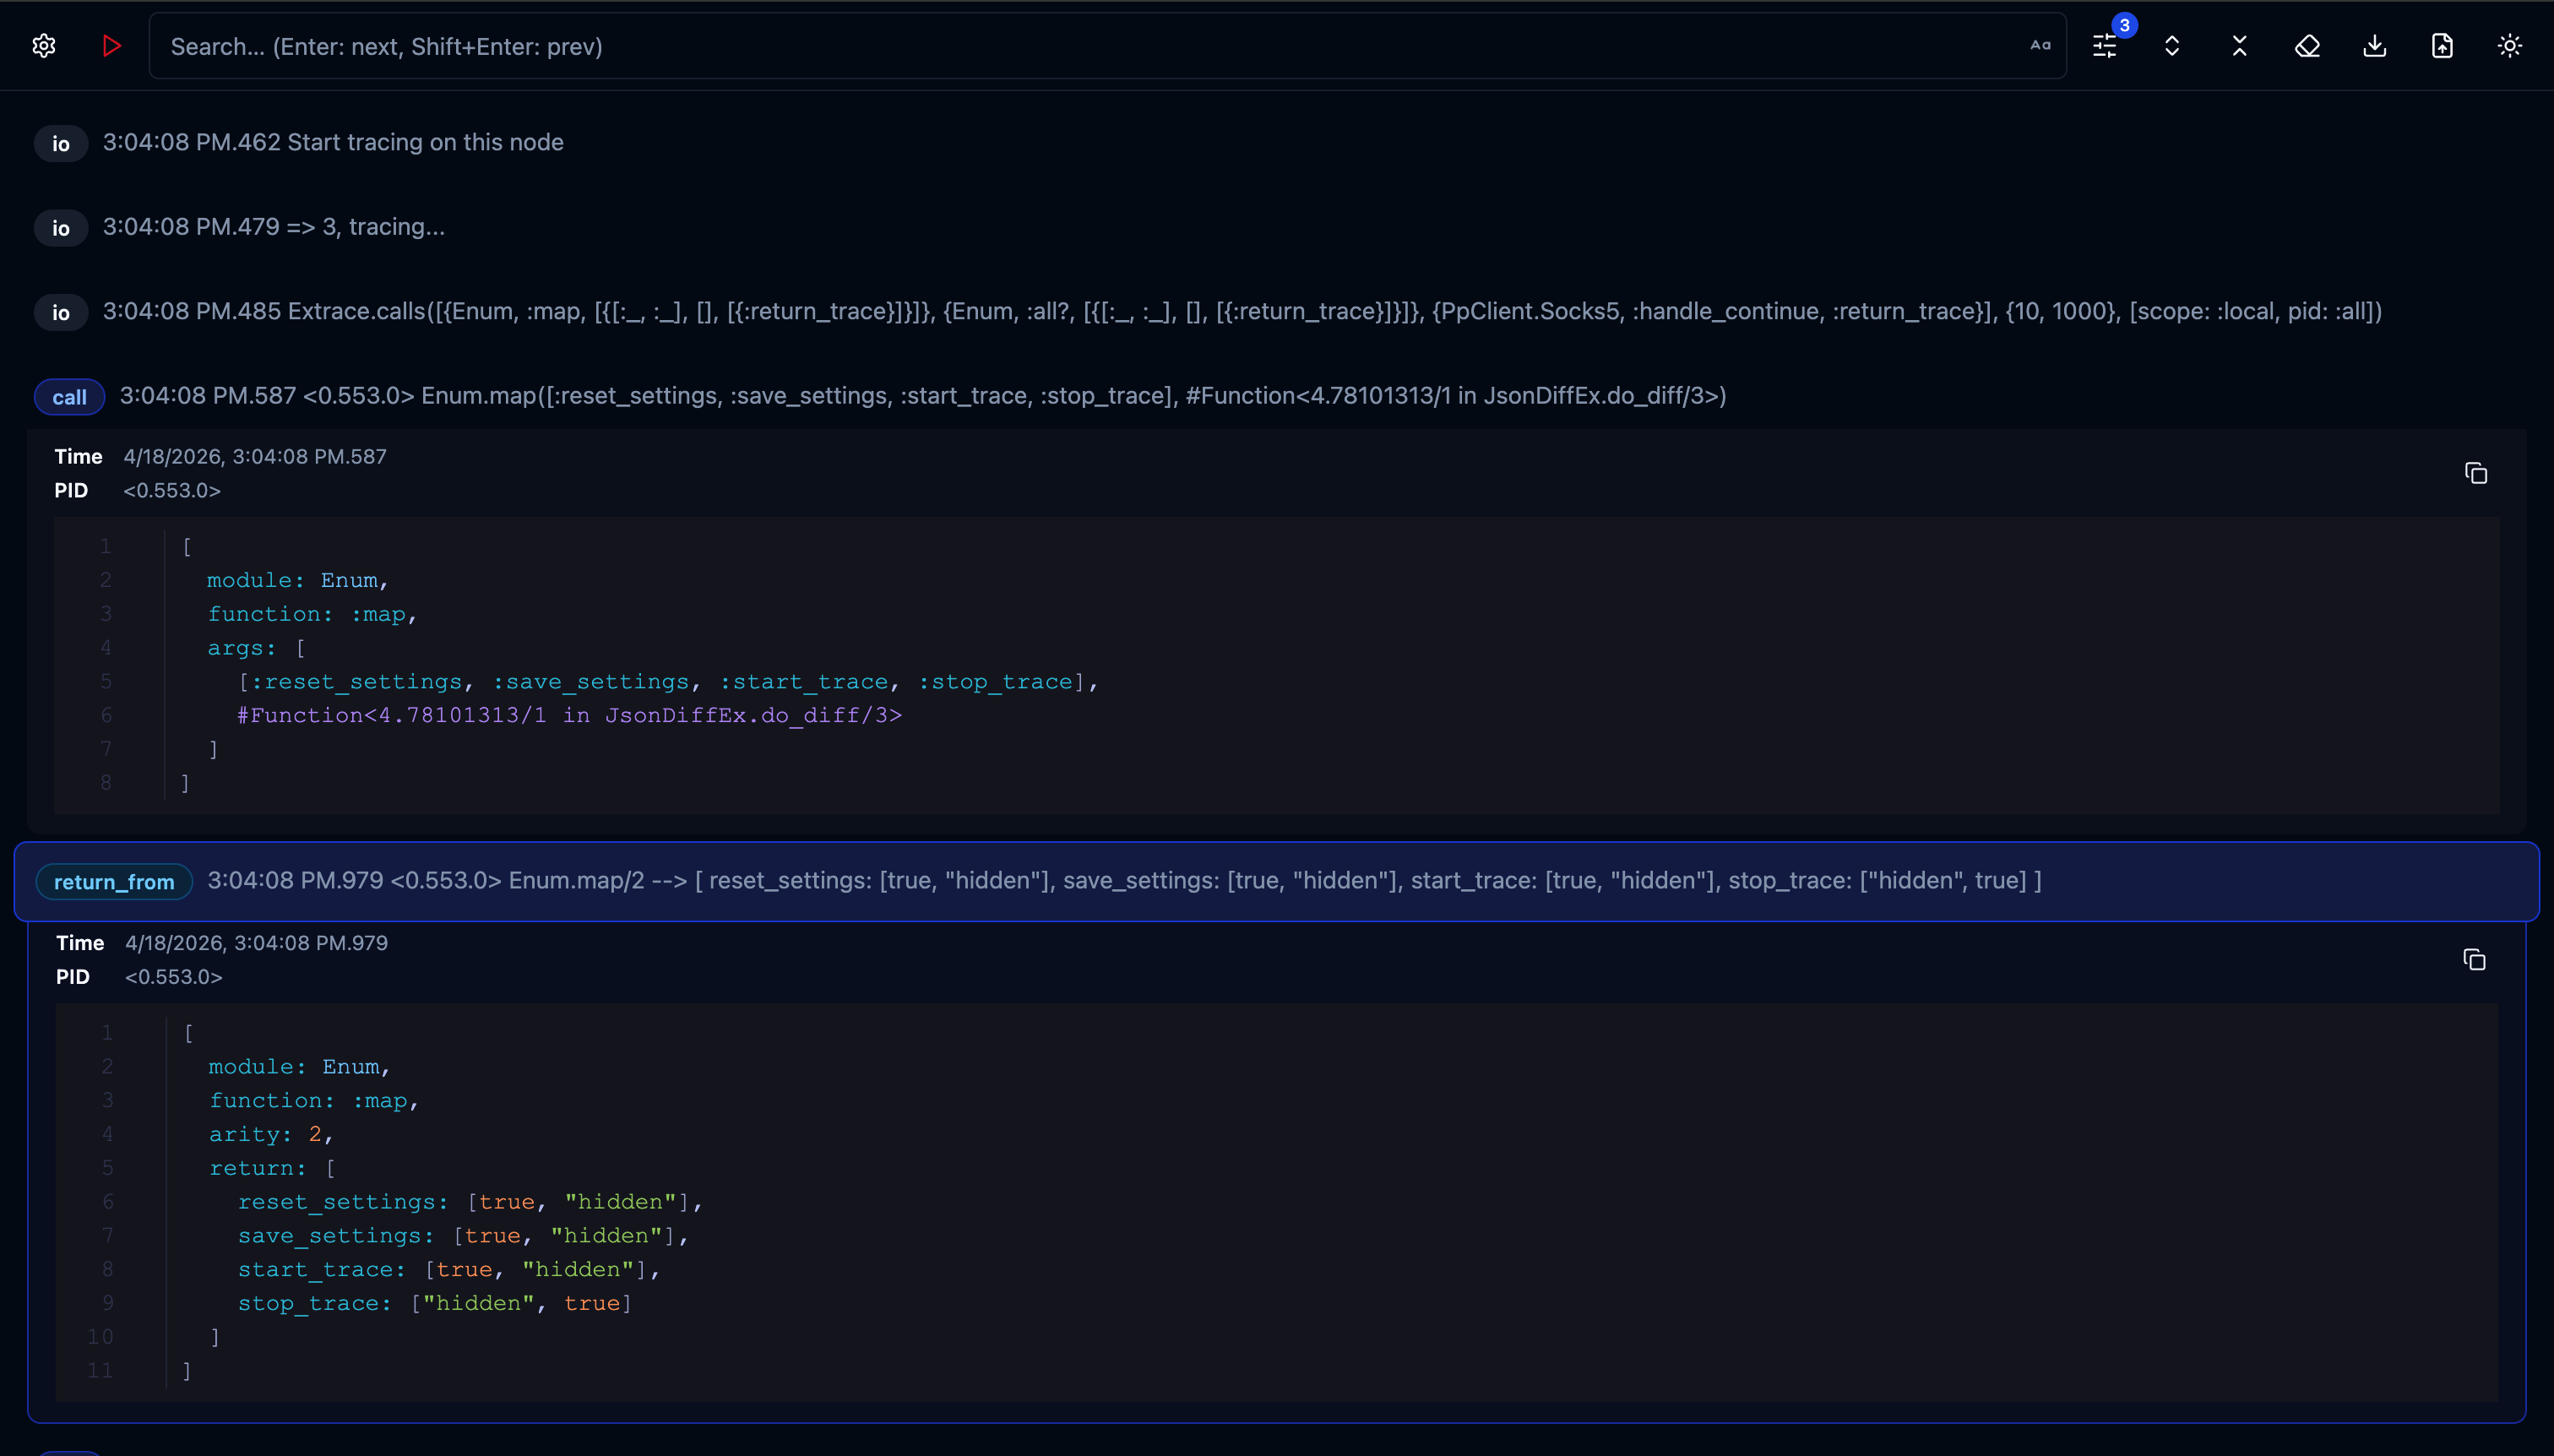
Start Tracing
Watch function calls stream in real-time — see arguments, return values, and timing.
See It In Action
Watch how X-Trace enables distributed tracing & function monitoring in real-time.
In this demo: Set up a Node environment → Connect to a Phoenix server → Specify target functions → Send curl requests to trigger logic → X-Trace collects data and monitors runtime in real time.
Everything You Need
Powerful BEAM tracing capabilities wrapped in an intuitive web interface.
Real-time Trace Streaming
Trace messages rendered live in the browser via Phoenix LiveView + Svelte. Zero latency feedback loop.
Local & Remote Tracing
Trace the local node or any connected remote BEAM node. Perfect for distributed system debugging.
Node Management
Setup Erlang distribution, connect/disconnect nodes, and auto-reconnect on failure — all from the GUI.
Flexible Trace Specs
Supports {Mod, :fun, args} tuples, &Mod.fun/arity syntax, and match specs.
Rate Limiting
Configurable max traces per time window to prevent overwhelming production systems. Safety first.
Scope & PID Filtering
Trace :local or :global scope. Filter by specific PIDs or process groups.
Settings Persistence
Save, load, import, and export trace configurations. Never lose your debugging setup.
Cross-platform CLI
Single-binary distribution for macOS (x86_64/aarch64), Linux (x86_64/aarch64), and Windows via Burrito.
Desktop App
Also available as a native desktop application for an even more integrated experience.
Built for Real-World Debugging
Whether you're debugging a production issue or profiling performance, X-Trace has you covered.
Production Debugging
Diagnose issues in live systems without restarts or redeployments. Attach to running nodes, trace specific functions, and see what's happening in real-time.
Performance Analysis
Identify bottlenecks and slow functions by tracing execution with return values. See exactly which function calls take the longest.
Function Call Tracing
Track execution flow through your application with flexible match specs. See arguments and return values in clean, formatted output.
Problem Investigation
Understand complex distributed system behavior by connecting to multiple BEAM nodes. Investigate hard-to-reproduce issues and race conditions.
Quick Start
Get up and running in seconds with pre-built binaries or the desktop app.
Option 1: Pre-built Binary
Download the CLI binary for your platform from Releases.
                # Run the binary (example for macOS ARM)

                ./xtrace_macos_aarch64


                # Then visit http://localhost:4000
Option 2: Desktop App
Download the desktop app from x_trace_desktop Releases.
Native desktop experience
⌨️ CLI Options
| Flag | Alias | Type | Default | Description |
|---|---|---|---|---|
| --ip | string | 127.0.0.1 | IP address to bind the HTTP server | |
| --port | -p | integer | 4000 | HTTP port |
| --node | -n | string | — | Remote node to connect to |
| --cookie | string | — | Erlang cookie for distributed connections | |
| --sname | string | — | Short name for Erlang distribution | |
| --name | string | — | Fully qualified name for Erlang distribution | |
| --open | boolean | false | Open browser automatically on start |
                # Start on a custom port

                ./xtrace_macos_aarch64 -p 8080
                # Connect to a running node

                ./xtrace_macos_aarch64 \

                  --sname xtrace \

                  --cookie mycookie \

                  --node myapp@localhost
Usage Guide
Step-by-step instructions for using X-Trace effectively.
- Open the Node Settings panel
- Enter a node name (e.g.
xtrace) - Choose short names (
--sname) or long names (--name) - Optionally set a cookie
- Click Setup
- Enter the target node name (e.g.
myapp@localhost) - Enter the cookie (if different from the default)
- Click Connect
- Use the Node Switcher to switch between connected nodes
Trace specs define which function calls to trace. Supported formats:
                    # Tuple format

                    {Enum, :map, :return_trace}

                    {MyApp.Repo, :all, :_}


                    # Capture syntax

                    &Enum.map/2


                    # Erlang modules

                    {:ets, :lookup, :return_trace}
Banned modules: recon_trace, io, lists are blocked to prevent tracing feedback loops.
Configure safe trace rates to protect production systems:
- Max: Number of traces allowed per window (1–1000)
- Milliseconds: Time window in milliseconds (100–10,000), leave empty for total count mode
-
Scope:
:local(default) or:global -
PID filter:
:all,:new,:existing, or specific PIDs (e.g.0.123.0)
- Add at least one trace spec
- Click Start Trace (▶)
- Watch trace messages stream in real-time
- Click Stop Trace (⏹) to end the session
The generated Extrace.calls(...) command is displayed for reference — you can copy it for use in IEx.